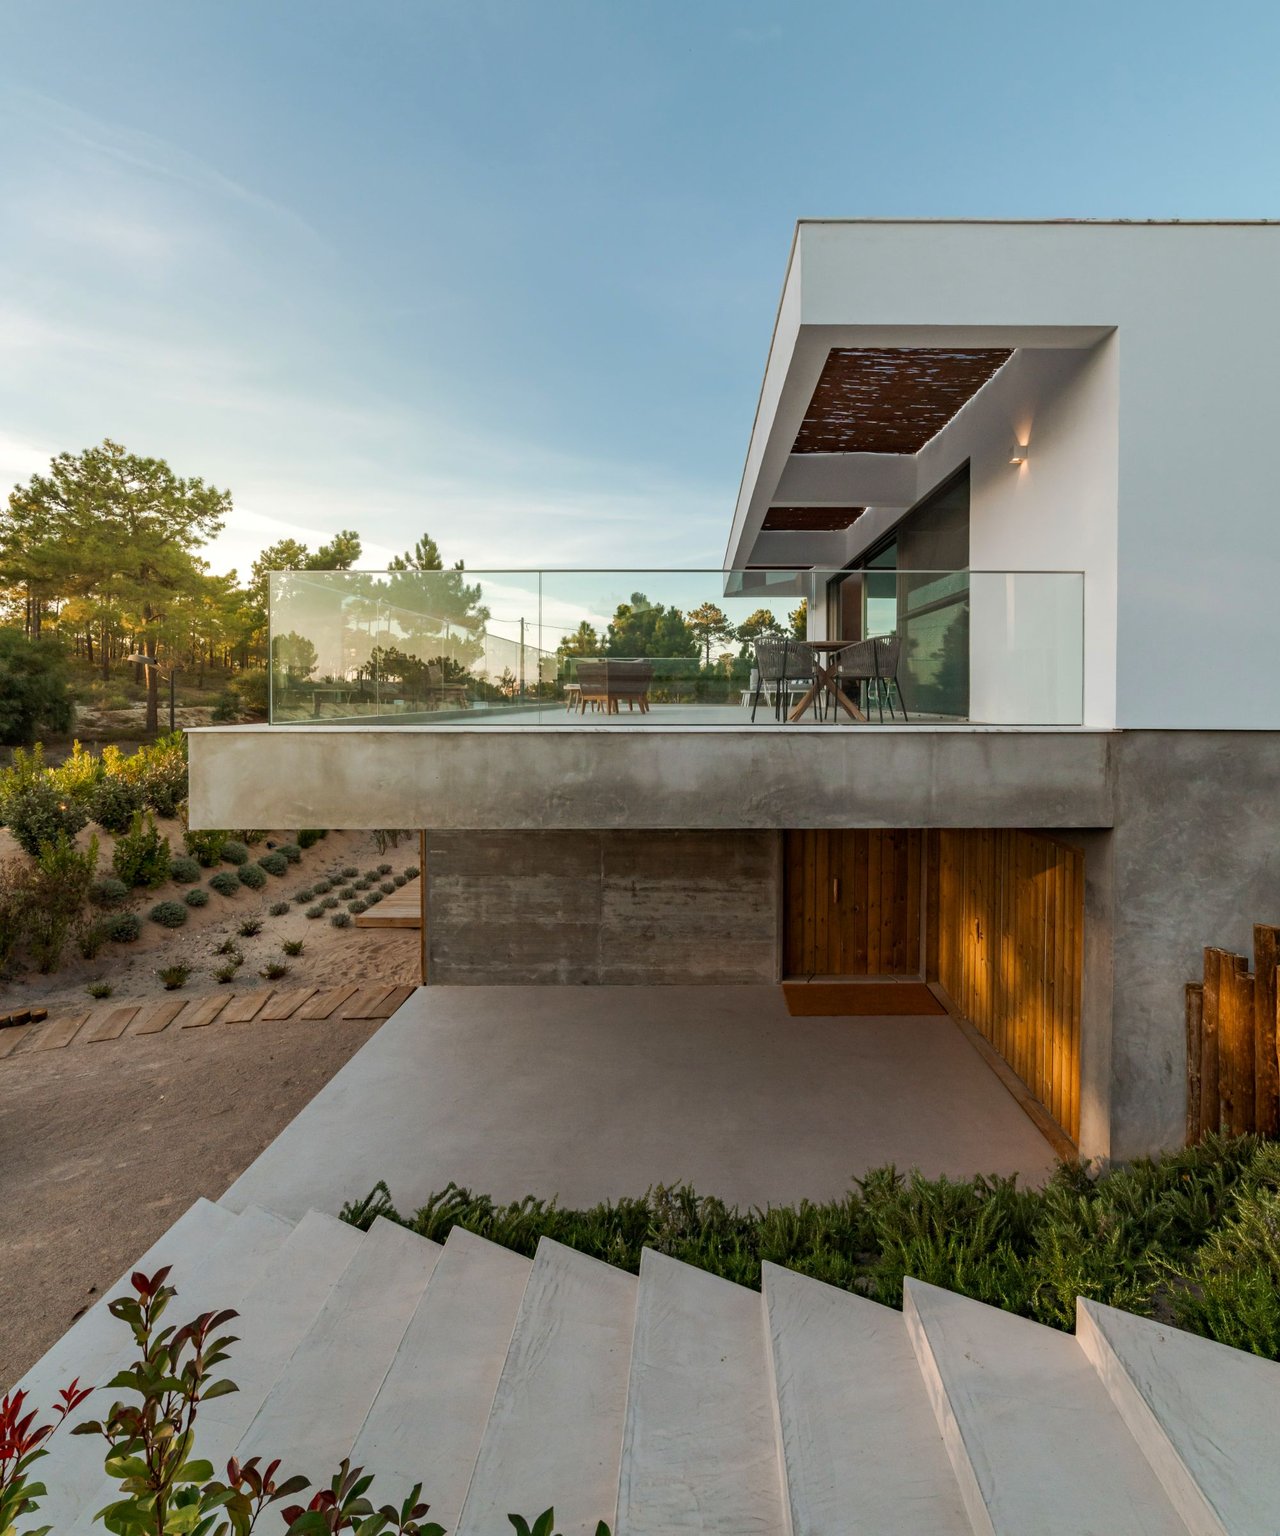
A buyer looking at Manhattan Beach this year does the math the way everyone tells them to. The Strand and the Sand Section are where all-cash offers live, so budget accordingly or look elsewhere. The Hill Section is thin on inventory and priced for view lots, so it's a different conversation entirely. That leaves the Tree Section: single-family streets running east from Sepulveda, tree-named avenues like Oak and Laurel and Elm, a section marketed for decades as the sensible, financeable middle ground between beachfront money and suburban space.
Then the offer on a $4.1 million listing on one of those streets goes to an all-cash buyer with no appraisal contingency, and the buyer with a pre-approval letter is left wondering what changed. The answer is in the data, and it isn't a story about the Sand Section getting more expensive. It's a story about where the city's cash is actually landing.
The Number Nobody Checks Before Writing an Offer
Cash purchases made up 45 percent of all Manhattan Beach home sales in 2025, the highest share recorded in nine years of local MLS tracking going back to 2017. That statistic alone tells a buyer the city is competitive. It doesn't tell them where.
A section-by-section breakdown of those same nine years of closed sales answers the more useful question: of every cash purchase that happened in Manhattan Beach in a given year, which part of the city did it land in? The pattern isn't static, and the direction of travel is the actual finding.
| Share of citywide cash purchases | Pre-pandemic | 2022 | 2025 |
|---|---|---|---|
| Sand Section | 43% | 42% | 34% |
| East Manhattan / Manhattan Village | 28% | 33% | 30% |
| Tree Section | 21% | 15% | 28% |
| Hill Section | 8% | 10% | roughly 8% |
Read the Tree Section row again. It dropped from 21 percent before the pandemic to a low of 15 percent in 2022, then nearly doubled to 28 percent by 2025, ending up above where it started. The dip in 2022 has a clean explanation: mortgage rates were still near historic lows, so even buyers who could pay cash often chose to borrow instead, since money was cheap enough that leverage made sense. Once that window closed and rates reset higher, cash reasserted itself everywhere, but it reasserted itself hardest in the Tree Section, not in the beachfront sections where cash has always concentrated.
That's the shift a financed buyer needs to internalize, and the most recent data suggests it went further than the nine-year trend line alone would predict. Citywide, the share of Manhattan Beach sales closing all-cash actually cooled in the first four months of 2026, dropping to 36 percent from levels near 50 percent in both 2024 and 2025. Yet within that smaller cash pool, the Tree Section pulled ahead of every other section in the city: 48 percent of its own sales closed without financing between January and April 2026, the highest concentration of any section in town for that stretch. Sand and the Strand have long carried the reputation as the most cash-intensive ground in Manhattan Beach. For the first four months of 2026, the data says the Trees took that title instead.
What the Median Price Actually Buys, Section by Section
Manhattan Beach's citywide median home price stood at $3.5 million as of July 31, 2026, continuing a run that has held between roughly $3.3 million and $3.5 million since the middle of 2025. As of August 15, 2026, the city had 67 active listings on the market, 51 single-family homes and 16 townhomes, a tight number for a city of roughly 35,000 residents.
That citywide median flattens four submarkets that don't behave alike. A neighborhood-level snapshot from April 2026 shows how far apart they actually sit:
| Section | Median sold price | Price per square foot | Days on market | Active listings |
|---|---|---|---|---|
| Sand Section | $4.05M | $2,320 | 42 | 41 |
| Tree Section | $3.275M | $1,482 | 26 | 30 |
| Hill Section | $8.4M | $1,644 | not reliably reported | 7 |
The Hill Section number deserves two caveats before anyone treats it as gospel. First, seven active listings is not a sample size, it's a handful of transactions that can swing a median by a million dollars depending on which two or three homes happen to close in a given month. That's a structural feature of the Hill Section, not a data error: the city's own planning documents cap the section as primarily single-family with a larger allowable lot size than Tree or the Beach Area, which keeps supply naturally scarce. Second, the Hill Section figure above was pulled from a different aggregator a month earlier than the Sand and Tree numbers, a reminder that median prices shift almost as much with methodology and timing as they do with the market itself.
The Tree Section's numbers tell a different story. It has the shortest median time on market of the three sections at 26 days, the deepest active inventory at 30 listings, and the lowest price per square foot. On paper, that reads like the easiest section to compete in. The cash-purchase data says otherwise: a rising share of the buyers writing offers there aren't waiting on a lender, which is exactly the kind of friction a 26-day market doesn't leave room to negotiate around.
Why the Tree Section, Specifically
Part of the answer is supply. The Tree Section is the largest single-family district west of Sepulveda, with close to 1,600 homes spread across pockets that carry their own identity: American Martyrs, clustered around the church and school of the same name with lots that run 50 feet wide; the Gas Lamp district near 21st through 24th Street, where original turn-of-the-century gas lamps still burn at night; and streets bordering Live Oak Park and the Veterans Parkway greenbelt, a 21-acre corridor with a mile and a half of walking and jogging trail running north to south through the neighborhood. More total housing stock means more total transactions, and more total transactions means more raw opportunity for cash buyers to concentrate there even without the section becoming more cash-intensive in percentage terms.
Part of it is what the section offers that the Sand Section physically cannot. Sand Section lots run 30 to 35 feet wide by city planning standards, built vertical because there's nowhere else to go. Tree Section lots run larger, often 4,600 to 5,600 square feet, enough room for a rebuild with a basement and a yard, which is precisely the kind of project a buyer with liquid capital and no financing timeline is positioned to move on quickly when it comes up.
Add in a decade of new construction activity, much of it developer-driven teardown-and-rebuild product landing in the $4 million to $6 million range, and the Tree Section starts to look less like Manhattan Beach's affordable compromise and more like its most active construction pipeline. That pipeline draws exactly the kind of buyer who doesn't need a loan to move on a good lot.
What This Means If You're Financing
None of this means a financed buyer should write off the Tree Section. It means the strategy that worked there five years ago needs an update. A pre-approval letter alone doesn't compete with an all-cash offer that can close in three weeks with no appraisal contingency. What does help is showing up with full underwriting completed rather than a conditional pre-approval, being ready to cover an appraisal gap if the property doesn't confirm value at the price a cash buyer would happily pay in a private transaction, and working with an agent who tracks off-market activity in the section as closely as the public MLS, since a meaningful share of Tree Section deals get put together before they ever hit a portal.
The assumption that Sand Section pricing rules it out deserves a second look, too. At $2,320 per square foot against Tree's $1,482, Sand costs more per foot, but its 42-day median time on market is actually longer than Tree's 26, and its 41 active listings give a financed buyer more shots on goal. Sometimes the section with the scarier price tag is the one where a mortgage contingency has more room to survive.
Is the Tree Section still less expensive than the Sand Section overall? On a total median price basis, generally yes, though the gap has narrowed and depends heavily on which pocket and which month you're comparing.
Why did Tree Section cash purchases dip in 2022 if rates were already rising? The 2022 low reflects the tail end of an era when borrowing was still cheap enough that even buyers who could pay cash chose to finance. The larger jump in cash share came once rates settled at a higher plateau and holding capital in cash lost less relative value.
Does this mean the Hill Section is now the easier section for a financed buyer? Not necessarily. Hill Section inventory is so thin, often single digits, that its cash share and pricing data are noisy month to month. It remains the section where a financed buyer is most likely to be competing against very few other offers of any kind, cash or otherwise, simply because so little comes to market.
Manhattan Beach's median price was never built to answer the question a specific buyer is actually asking, which is where their specific budget and their specific financing timeline are competitive right now. That answer changes section by section and, based on the last three years of data, it changes faster than most buyers expect. If you're weighing Sand against Tree against Hill and want a read on where your offer actually stands a chance, ARIA Properties can walk you through the current section-level picture and get your instant home valuation started before you write anything.